
By Jason Novack
A couple weeks ago, data analyst Joey Cherdarchuk published a beautiful visualization of the “Breathing City,” using census and open data to show how people move about Manhattan over the course of a typical workday. The animation offers a compelling look at the city’s land use and infrastructure challenges, and a glimpse of what life is like for the millions of people that live and work here.
Any project at this scale requires its creators to make a number of assumptions, and the Breathing City is no exception. To model where people spend their time throughout the day, Cherdarchuk used the American Time Use Survey by the federal Bureau of Labor Statistics. His acknowledgement that, “Manhattan probably has a different profile than the US average” inspired me to dig in to Placemeter’s data store and see if we can help replace this assumption with some real-world observations.
Placemeter uses live video feeds to collect data that describes activity at physical places. We are quantifying how people interact with one another, the city, and the infrastructure that defines it. With each passing day, our growing data set becomes exposes the underlying laws that govern life in our modern city—one of the most complex and fascinating systems in the world.
I started by pulling the foot traffic time series data we have in the areas surrounding Manhattan’s four major transit hubs: World Trade Center, Pennsylvania Station, Grand Central Terminal, and Port Authority Bus Terminal. I then cut out weekends and holidays and averaged the remaining days to generate a “typical” work day. The results show, as Cherdarchuk expected, there is a level of detail missing from the nationwide time use survey.
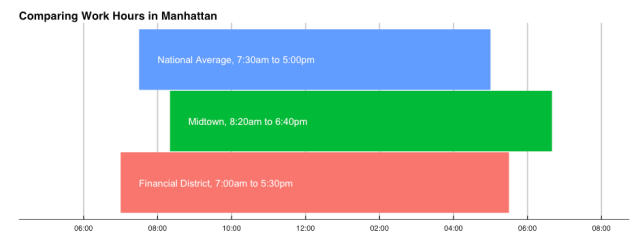
I found that not only are work hours in Manhattan different from the national averages, but they even vary by neighborhood within the city. Morning rush hour in the Financial District peaks right around 7:00 AM, while Midtown peaks at 8:20 AM. The data tells a similar story for evening rush hour. People working downtown head home about an hour earlier than people in midtown, 5:30 PM and 6:40 PM respectively. Both groups work a bit longer than the bulk of individuals surveyed by the Bureau of Labor Statistics.
Intuitively, these results make sense to me. Census data confirms that the finance industry dominates the economy around the World Trade Center. As such, their work schedules seem to follow market hours (9:30 to 4:00), with some time in the morning to catch up on news and prepare for the opening bell. Meanwhile, the finance industry makes up only 14% of the jobs near Grand Central Terminal as part of a much more diversified economy, including industries that follow traditional office hours (9:00 to 6:00).
Placemeter’s ability to track these differences allows us to provide the best data available. From improving pedestrian safety and optimizing park space, to aiding commercial real estate analysis and measuring outdoor advertisement campaign performance, we can serve a variety of applications in New York City and around the world.
